The Flex Rule: How PSA Grades Centering on 2025 Topps Chrome
Data from 104 PSA-graded slabs.
Like everyone else, I was confused by 2025 Topps Chrome centering this past year. Too many ways to measure a card, and no consensus on which was right. Team name? Inner border? Something else entirely?
With 2025 Topps Chrome Football hobby out and retail coming soon, I didn’t want collectors walking into the same confusion a lot of baseball and basketball collectors went through. So I measured 54 PSA 10s and 50 PSA 9s from Topps Chrome 2025 (Basketball, Baseball, F1) releases to figure out what PSA is actually doing.
Note: This analysis only covers front centering. PSA’s back centering tolerance is 75/25 for a 10, which is generous enough that backs rarely factor into the grade.
The Flex Rule
On 2025 Topps Chrome, each centering axis has two plausible places to measure, and for any given card, they often disagree. That creates a problem: which reference does PSA use?
The data suggests PSA doesn’t pick one: grading appears to accept either reference as long as it clears the tolerance. I’ll call this the flex rule.
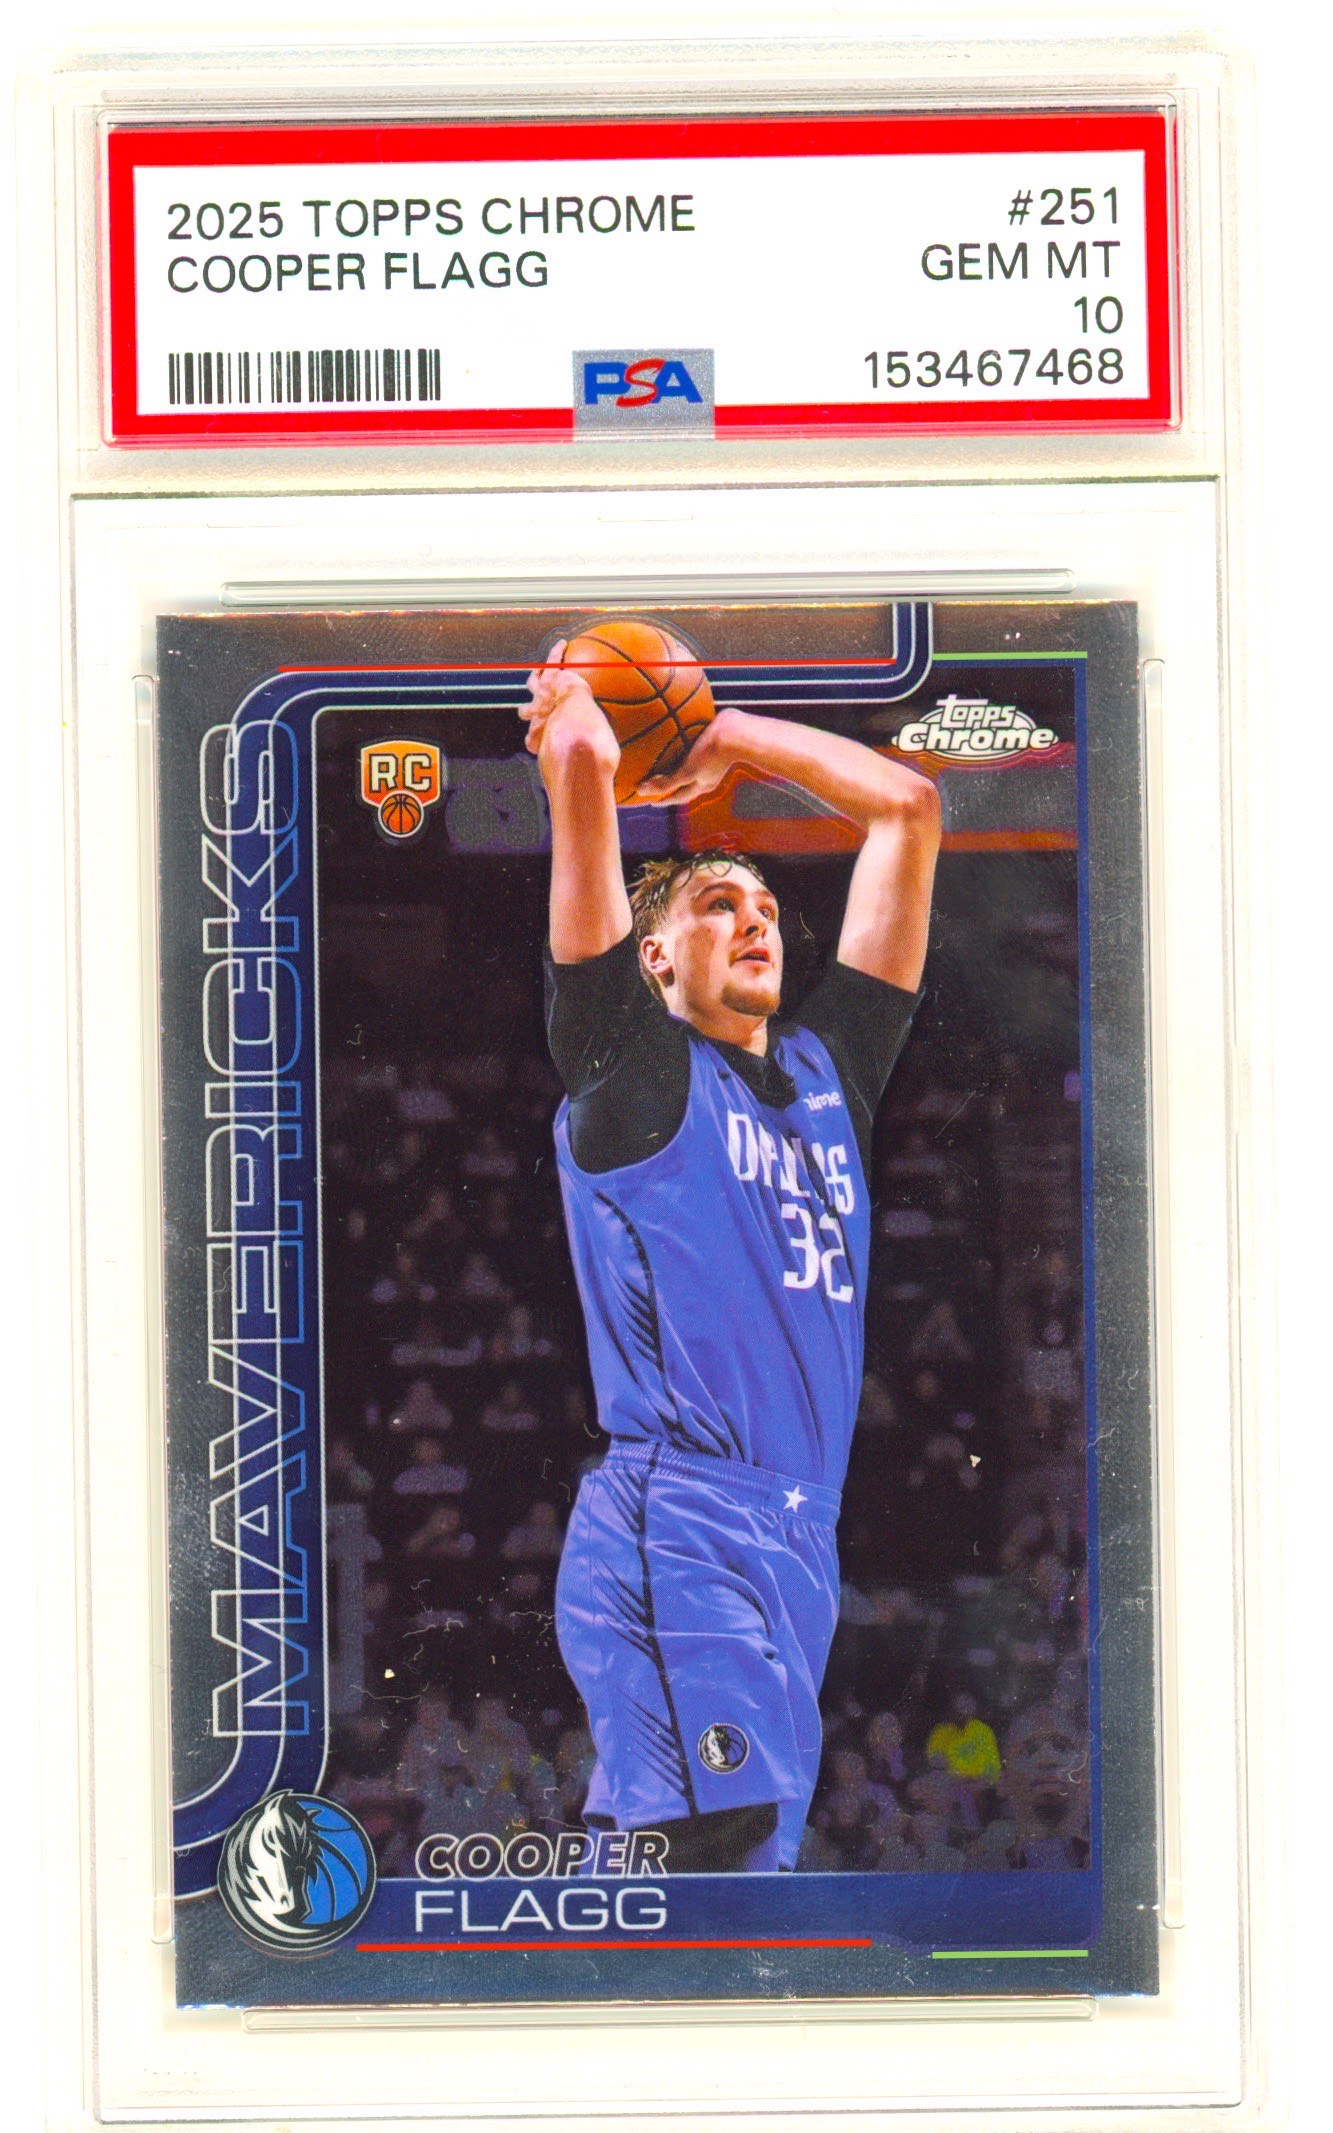
Here’s the same Cooper Flagg base card measured two different ways:

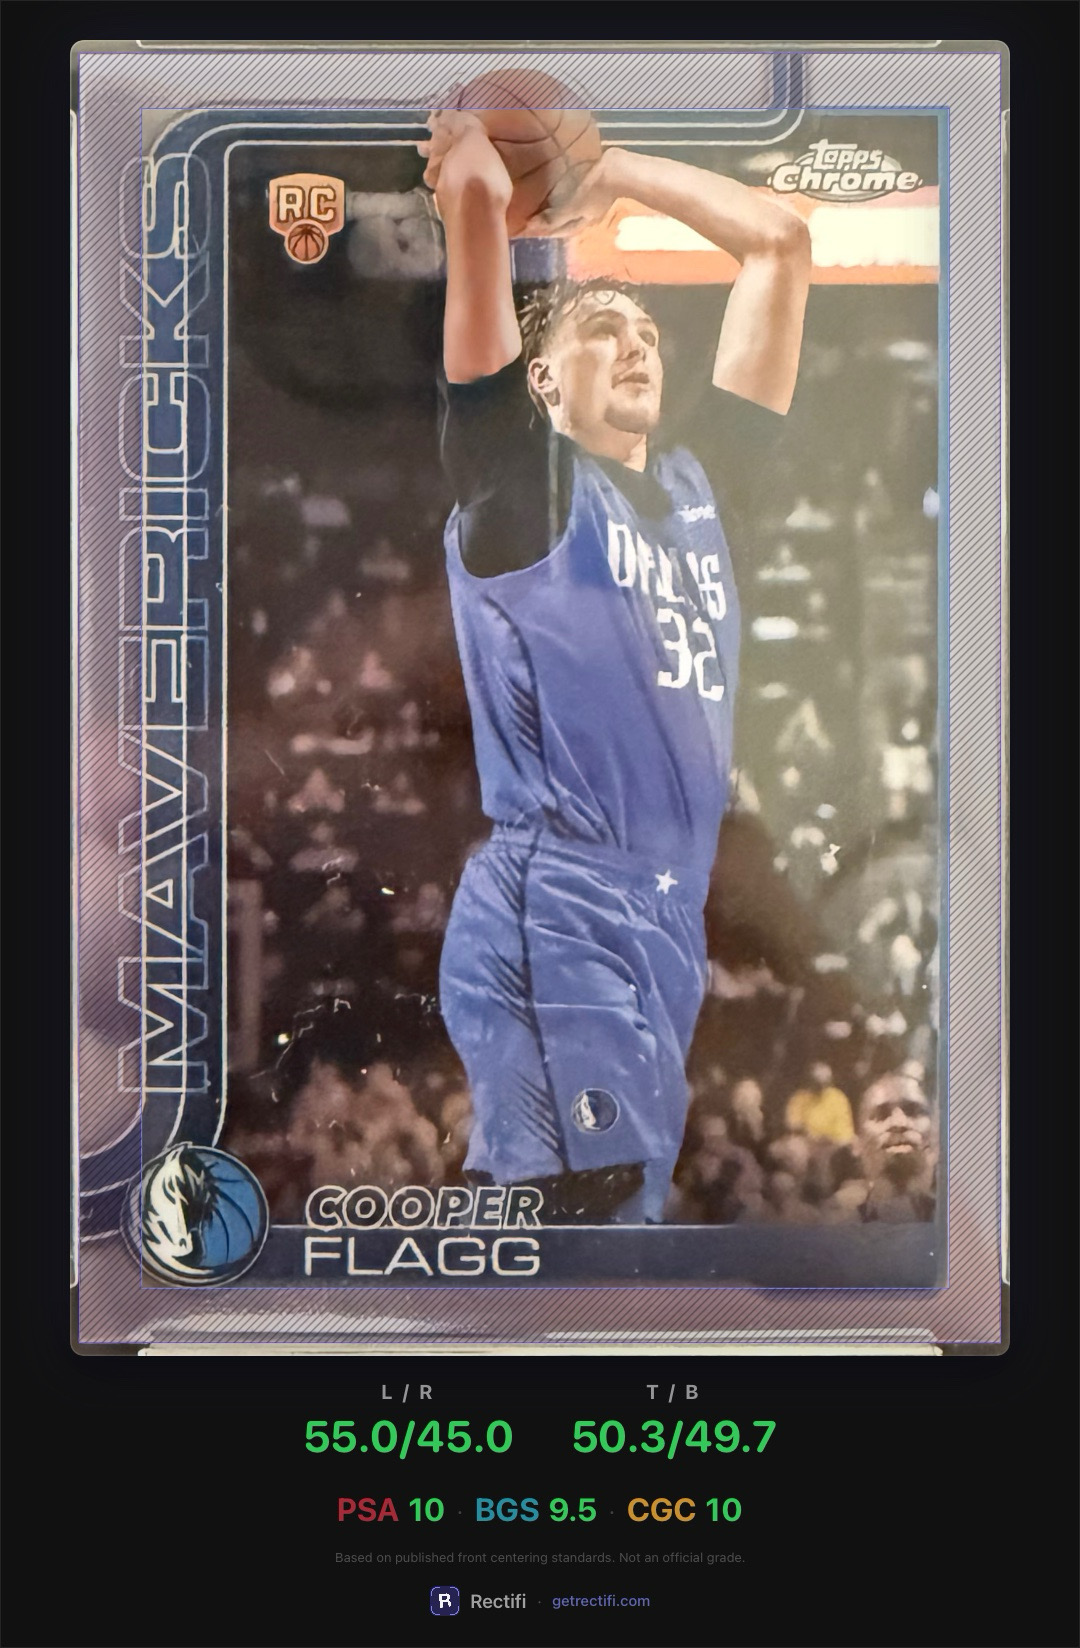
Same card, measured two different ways. The “borders” aren’t in the same place on either axis.
Across 54 PSA 10s in the dataset, this pattern holds on both axes:
| Flex outcome (PSA 10, n=54, at 55/45) | L/R | T/B |
|---|---|---|
| Passes flex | 51 (94%) | 53 (98%) |
| Fails flex | 3 (6%) | 1 (2%) |
Fewer than 1 in 10 PSA 10s fails the flex rule on either axis. And nearly every L/R fail misses by less than 1%, consistent with the “eye appeal” latitude PSA’s published standards allow for on borderline cards. Details in the L/R section below.
How the flex rule plays out on each axis differs in instructive ways. On L/R, the two references are offset by design, so a card almost never passes both. On T/B, the references usually agree, and passing both is common. That’s the signal that separates 10s from 9s.
L/R Centering
Two References, Never Both Centered
On 2025 Topps Chrome, there are two plausible places to measure L/R centering:
- The team name runs vertically down the left edge of the card (e.g., “MAVERICKS” on the Cooper Flagg)
- The inner design border is the thin chrome-colored frame around the photo that cuts through the team name
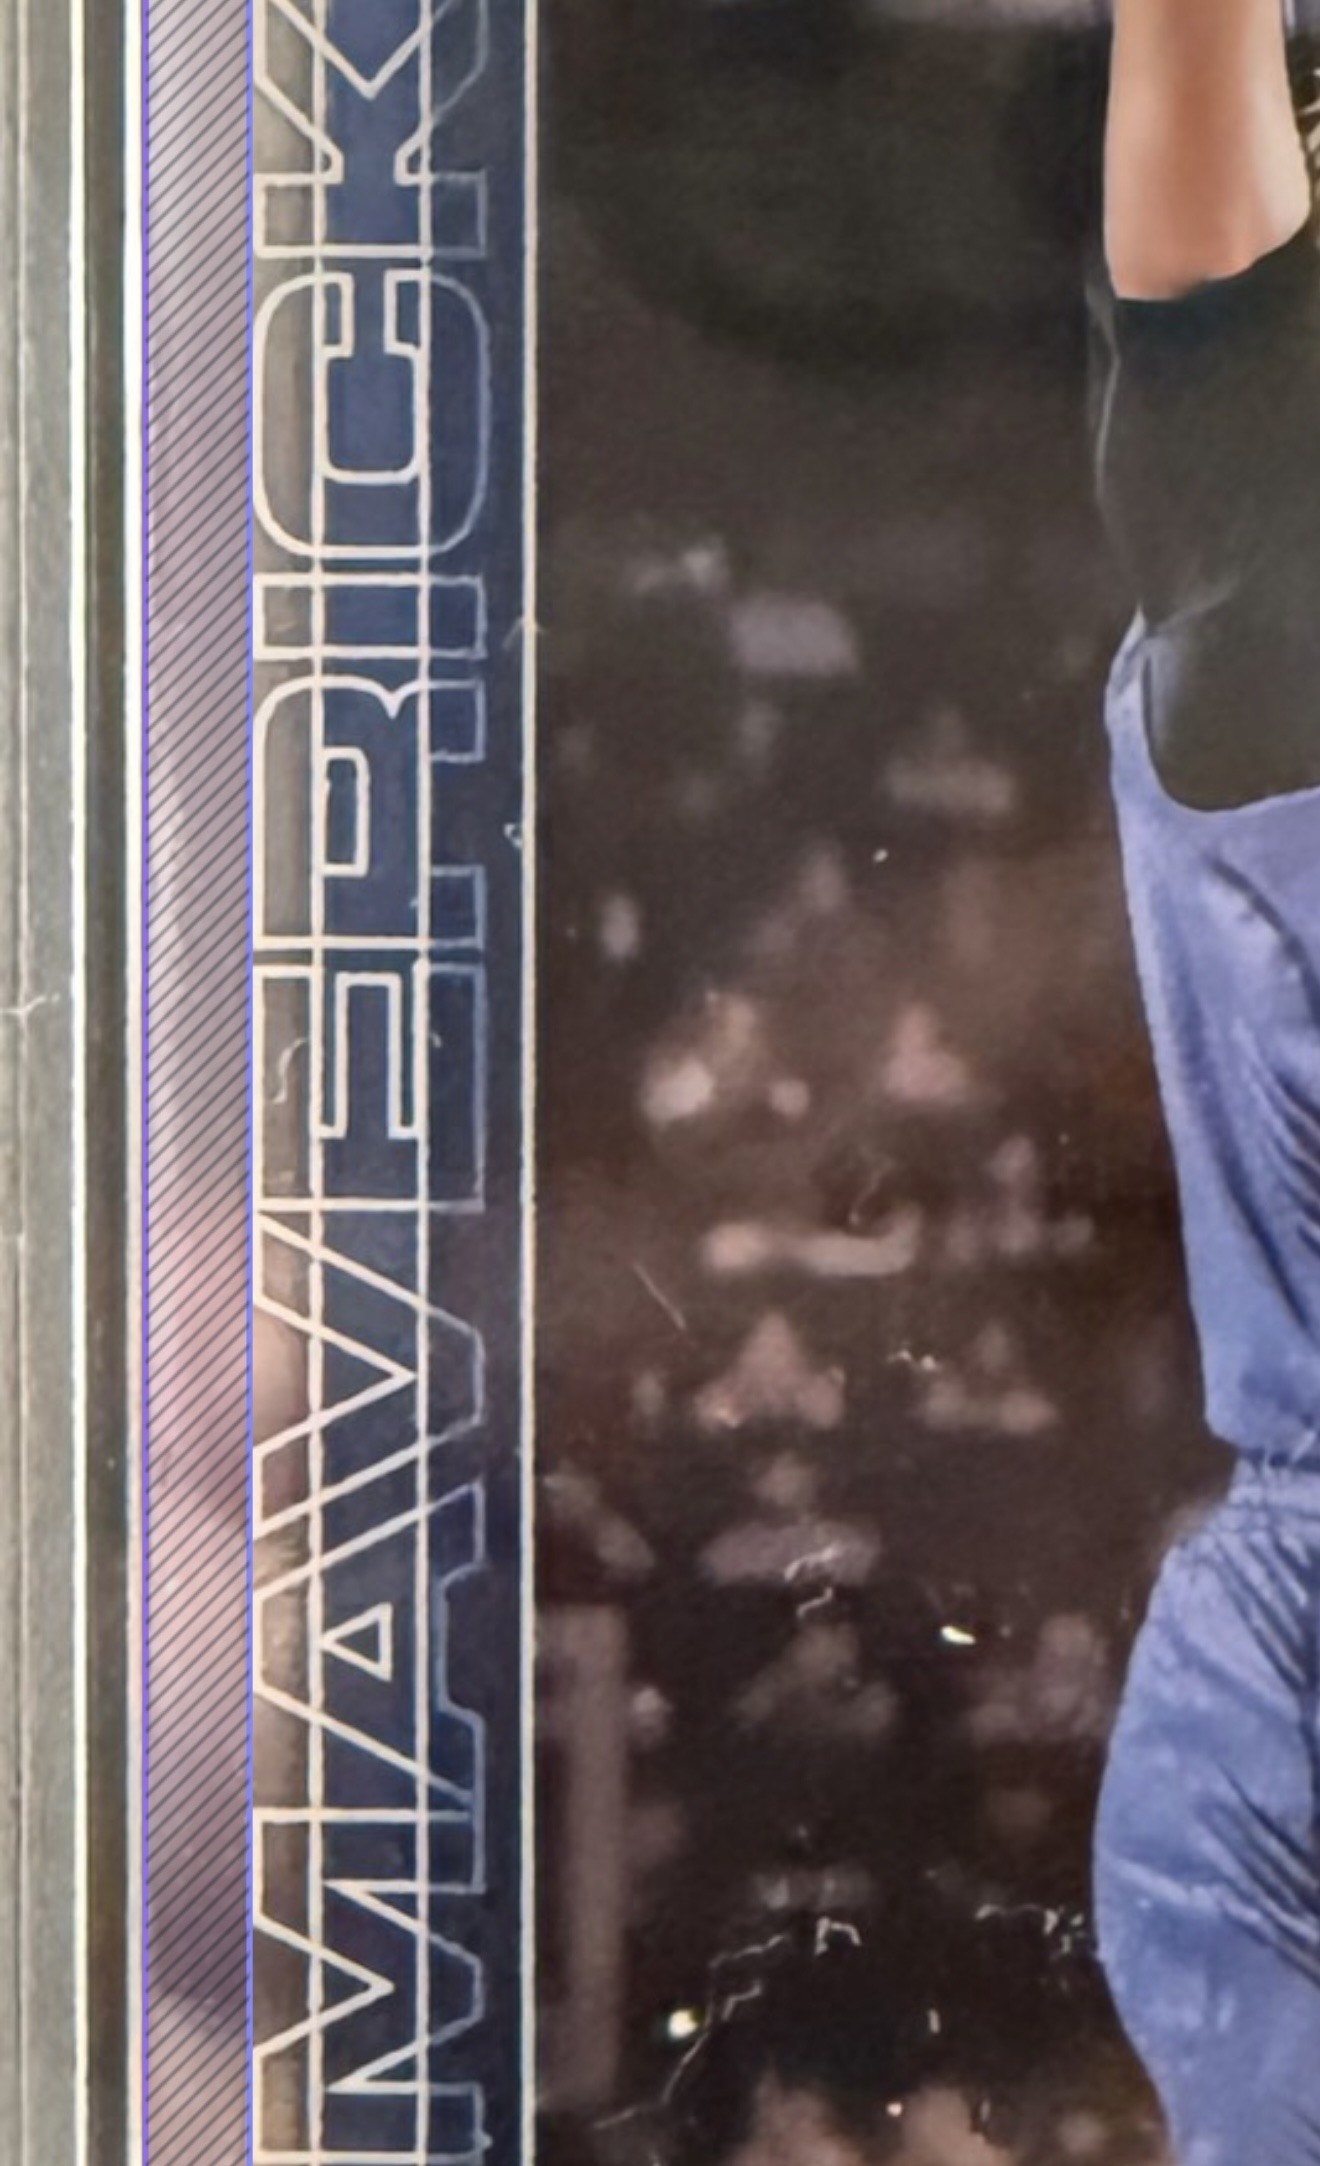
Team name reference Measured to the outer edge of the “MAVERICKS” text.
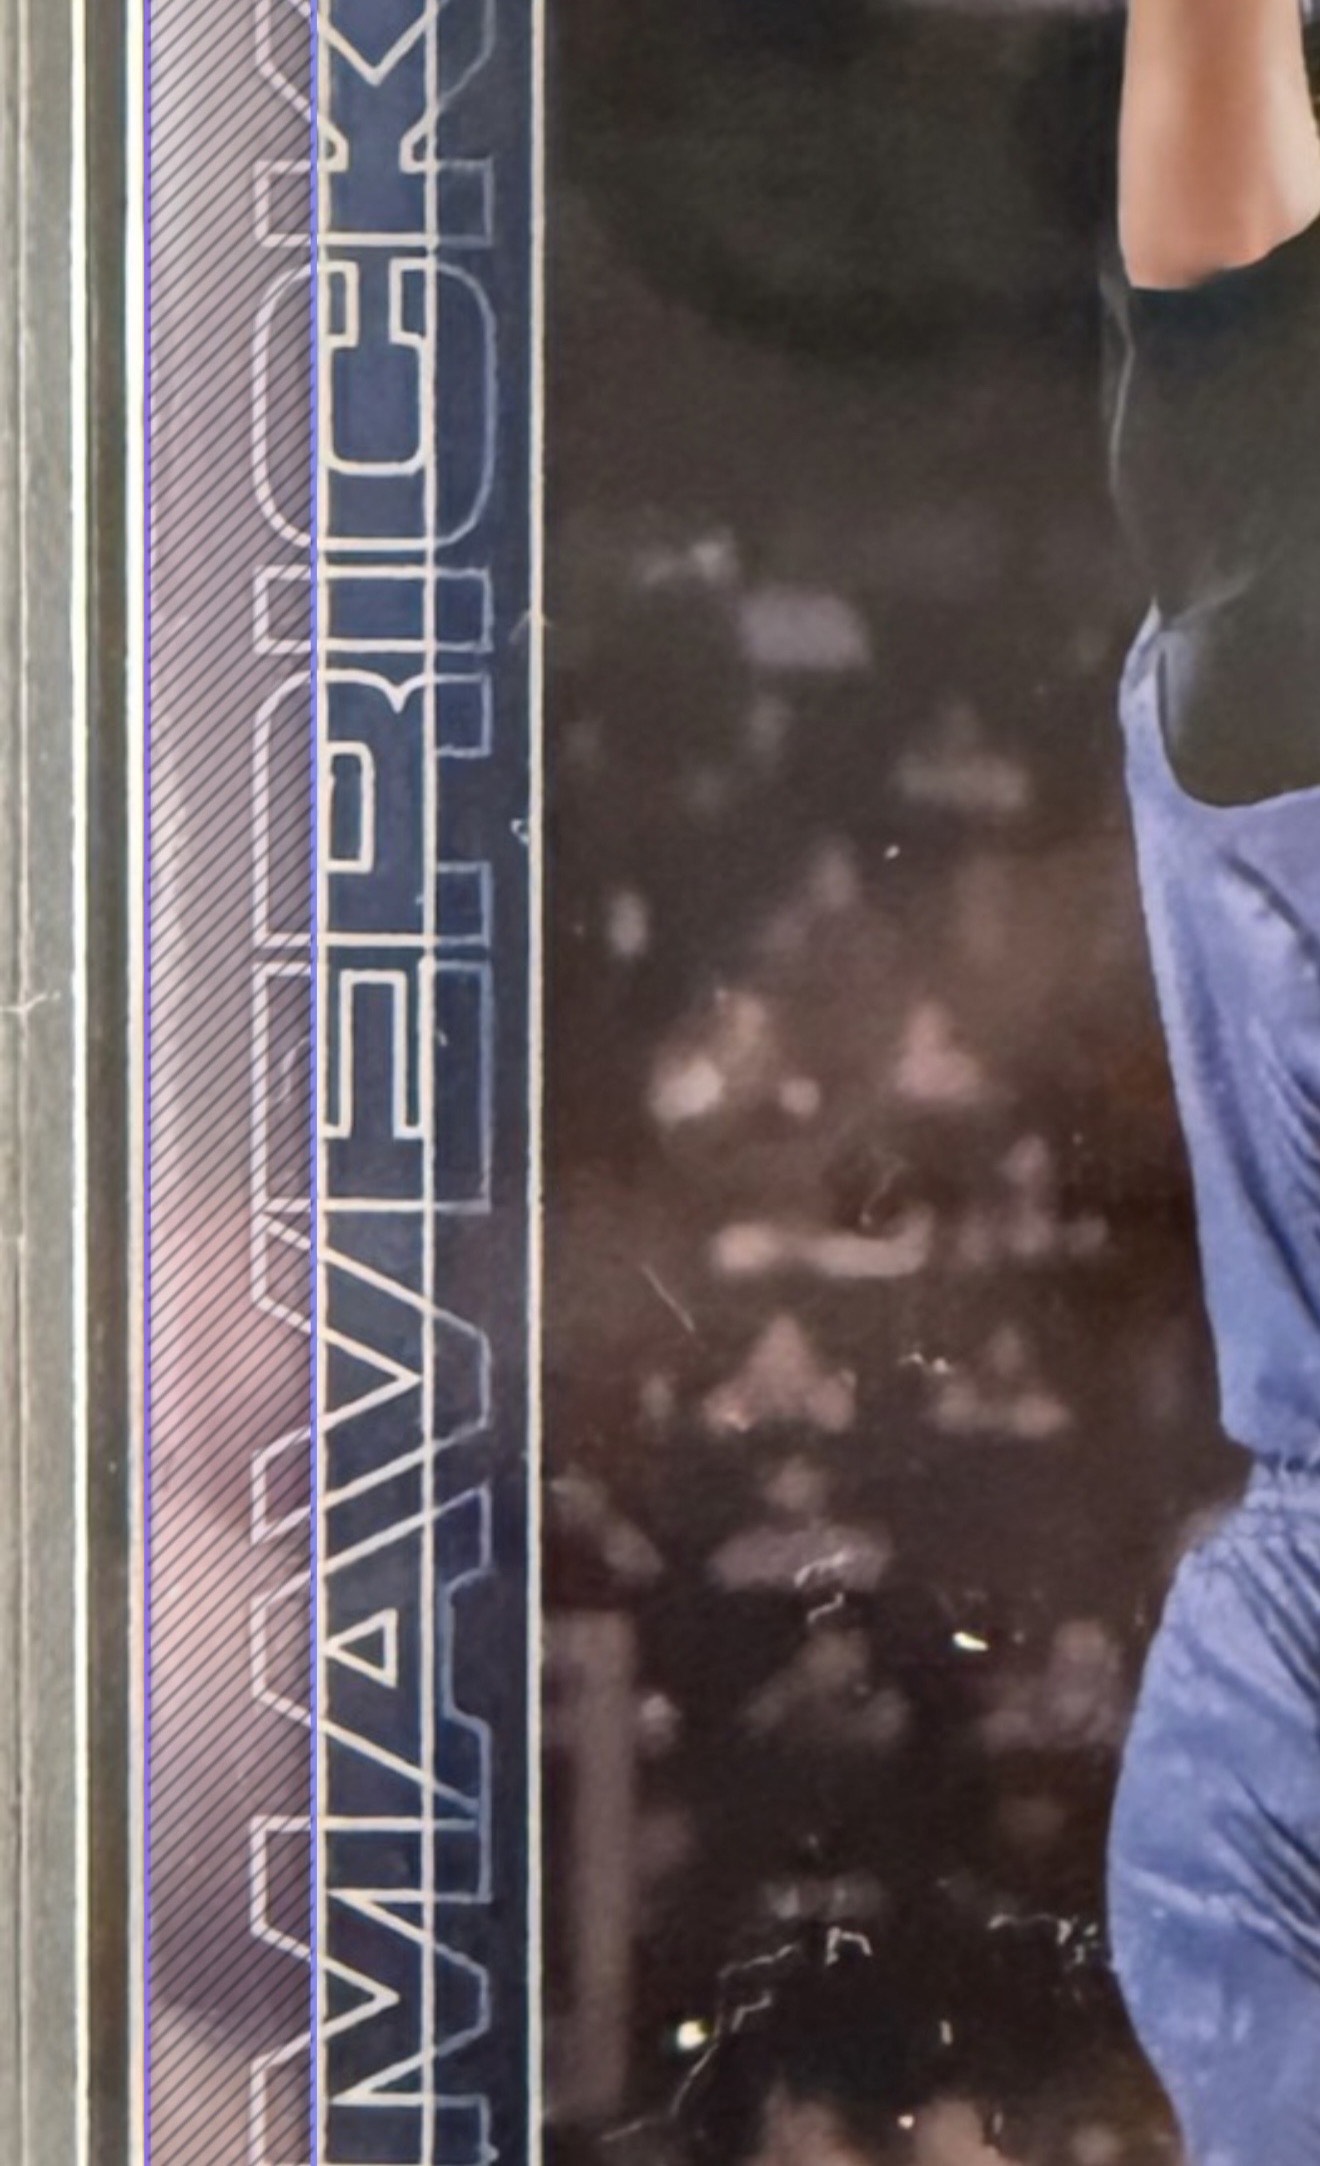
Inner border reference Measured to the thin chrome frame that cuts through the letters.
Two valid L/R reference points, offset from each other on the same card. A shift that centers one knocks the other out.
These two references are offset from each other by design. The team name sits at one horizontal position on the card, and the inner border cuts through it at a different horizontal position. When one is centered against the card edges, the other usually isn’t. They can almost never both be centered at the same time.
The flex rule resolves this ambiguity by accepting whichever reference passes.
PSA 10 vs PSA 9
The flex rule explains what PSA does on L/R, but raises a follow-up: if PSA accepts either reference, does L/R centering actually matter for the grade?
Comparing 54 PSA 10s to 50 PSA 9s from the same set:
| L/R outcome (at 55/45) | PSA 10 (n=54) | PSA 9 (n=50) |
|---|---|---|
| Team Name passes | 34 (63%) | 25 (50%) |
| Inner Border passes | 17 (31%) | 12 (24%) |
| Fails both | 3 (6%) | 13 (26%) |
Most 9s still pass L/R via the flex rule. 94% of 10s and 74% of 9s pass at least one L/R reference. The flex rule is generous enough that most cards at both grades satisfy L/R centering.
Where the grades differ is at the failure tail: 6% of 10s fail both L/R references vs 26% of 9s. More than 4x higher failure rate for 9s. These are the cards off-center enough that neither reference saves them.
Digging into those failures reveals a consistent empirical pattern:
| L/R “fail both” severity (at 55/45) | PSA 10 | PSA 9 |
|---|---|---|
| Miss by <1% (near-miss) | 3 (100% of fails) | 9 (69% of fails) |
| Miss by ≥1% | 0 | 4 |
Every single PSA 10 that failed both L/R references is within 1% of passing, and all three cluster in the same corner of the scatter below: team name just under 45, inner border just over 55. That’s a card drifted just far enough in one direction to miss both edges simultaneously. The pattern is consistent with the eye-appeal latitude PSA’s published standards allow for on borderline cards.

T/B Centering
Big Bottom, Bigger Bottom
The T/B axis works differently from L/R. The inner border on this design isn’t a simple rectangle. The top and bottom curve and dip in ways that make measurement location matter. There are two reasonable places to measure T/B, and the abbreviations describe where along the card the measurement is taken:
- TR/BR (Top-Right to Bottom-Right): at the right side of the card, where the border sits slightly higher on top and dips at the bottom
- TM/BM (Top-Middle to Bottom-Middle): at the middle of the card, where the border sits slightly lower on top and curves upward on the bottom (the border below “FLAGG”)
Unlike L/R, these two T/B points can agree, but can amplify bottom-heaviness. When TR/BR reads bottom-heavy, TM/BM reads more bottom-heavy: same sign, bigger number. When references agree, there’s no flex available. Worse centering shows through directly. That’s why T/B ends up being the more meaningful discriminator between grades.
PSA 10 vs PSA 9
Here’s the full T/B breakdown at 55/45:
| T/B outcome (at 55/45) | PSA 10 (n=54) | PSA 9 (n=50) |
|---|---|---|
| Pass both | 32 (59%) | 15 (30%) |
| TR/BR only | 12 (22%) | 7 (14%) |
| TM/BM only | 9 (17%) | 15 (30%) |
| Fail both | 1 (1.9%) | 13 (26%) |
A few things jump out. First, 59% of PSA 10s pass both T/B references vs. 30% of PSA 9s. On L/R this comparison is meaningless because no card ever passes both references. On T/B, “passes both” is actually achievable, and it’s a signal that shows up much more often at the 10 grade level.
Second, only 1.9% of PSA 10s fail both T/B references vs 26% of PSA 9s. 10s almost never fail T/B. This is where T/B really separates from L/R. On L/R, 6% of 10s fail both references (via flex slack). On T/B, fails are essentially nonexistent for 10 grades.
There’s also a third pattern worth noting: zero PSA 10s miss T/B by less than 1%. On L/R, 3 of 54 10s missed both references by under 1% (the near-miss zone). On T/B, none do. PSA appears to enforce T/B more strictly than L/R.

No 10s Failed Both Axes in This Sample
Combining both axes into one view:
| Outcome (at 55/45) | PSA 10 | PSA 9 |
|---|---|---|
| Passes both axes | 93% | 56% |
| Fails L/R only | 6% | 18% |
| Fails T/B only | 2% | 8% |
| Fails both axes | 0% | 18% |
Zero PSA 10s fail on both axes simultaneously, vs. 18% of 9s. Every 10 that slips on one axis cleanly passes the other. PSA appears to tolerate a single centering deficiency on a 10, but in this sample never two stacked together.
More broadly: 93% of PSA 10s pass 55/45 on both axes. Only 56% of PSA 9s do. The gap is driven more by T/B than L/R. It’s the axis where 10s achieve near-perfect pass rates, and where 9s most visibly fall off.
The Framework Holds at 60/40 Too
PSA’s published tolerance for a 9 is 60/40. Applying the same flex rule at that looser threshold, the framework accounts for virtually every 9 in the dataset:
| PSA 9 outcome at 60/40 | Pass rate |
|---|---|
| L/R flex pass | 49/50 (98%) |
| T/B flex pass | 50/50 (100%) |
| Passes both axes | 49/50 (98%) |
The only card that misses L/R at 60/40 does so by 0.3% on team name, consistent with eye-appeal latitude. Between the flex rule and eye appeal, every PSA 9 in the dataset is accounted for by the same framework as PSA 10s, just at the looser tolerance. Same structure, different threshold.
Related: What BGS Centering Subgrades Actually Require, which analyzes the same tolerance-stack pattern for Beckett’s subgrades.
Takeaways
If you’re eyeing a raw 2025 Topps Chrome for submission, the checklist is short:
Team name vs. inner border doesn’t matter. PSA accepts either. If one of them reads within 55/45, your L/R is fine.
Reference choices are independent across axes. Picking team name for L/R doesn’t pair you with TR/BR for T/B (or vice versa). Each axis gets graded against whichever of its two references is closer to centered, independent of what happens on the other axis. The Cooper Flagg example earlier is a clean visual but not a grading convention.
T/B is the tighter standard. On L/R, 6% of 10s and 26% of 9s fail both references. On T/B, 2% of 10s and 26% of 9s fail. 10s are essentially always clean on T/B; L/R is where even 10s can be marginal.
Centering is one of four axes. Corners, edges, and surface still matter independently. A perfectly centered card can drop to a 9 on any of them. This post only addresses centering.
Check Your Cards Before You Submit
Rectifi reads both L/R and T/B references from any photo, perspective-corrected. Free on iOS.
Dataset
- Total: 104 PSA-graded slabs from 2025 Topps Chrome (54 PSA 10s, 50 PSA 9s)
- Sport composition: 61 Basketball (34 PSA 10s + 27 PSA 9s), 41 Baseball (18 + 23), 2 Sapphire F1 (2 + 0)
- References measured per card: Team Name L/R, Inner Border L/R, TR/BR T/B, TM/BM T/B
Both L/R and T/B failure rates differ significantly between grades. L/R fail-both-references rate: 5.6% (10s) vs 26% (9s), p < 0.01. T/B fail-both-references rate: 1.9% (10s) vs 26% (9s), p = 0.0003. The both-axes pass-rate difference (93% vs 56%) is highly significant (p < 0.0001). Statistical tests were run with LLM assistance. If something looks off, I’d welcome a correction.
The main findings are well-supported at this sample size (all key comparisons reach p < 0.01). Where the sample is tighter is on rare-event claims like “no 10s failed both axes”: that 0% has a meaningful upper confidence bound at n=54, which is why the heading says “in this sample.” Cards were measured from slab images, so any bow or curve inside the slab could shift a reading, particularly on cards that sit close to a threshold. This risk is asymmetric on T/B: a vertical bow would bias the TM/BM reading more than TR/BR (because the middle of the card deflects more than the edges), which is specifically the reference the stronger-discriminator finding rests on. One card in the dataset doesn’t cleanly fit the model; human grading at scale will always have some variance. If you have additional graded cards from this set and want to contribute measurements, reach out.