The 52/48 Rule: What BGS Centering Subgrades Actually Require
Data from 155 BGS-graded slabs.
If you’ve ever looked at a BGS slab and had questions like:
- Why did my card get a Centering 9.5 and not a 10?
- My card is within 55/45. Why is it a 9 and not a 9.5?
- How close to 50/50 does a card actually need to be for a Centering 10?
The answer to most of them is one ratio: 52/48.
BGS’s published standards define centering at the overall grade level, but they don’t explain what separates one subgrade from another. Half-point grades are described as “characteristics from both the level above and below.” Not quite sure how to interpret that.
To find out, I used Rectifi to measure the precise centering of 155 BGS-graded slabs. Here’s what I found.
Focus on the Front
One ratio defines a perfect centering subgrade: 52/48. Here’s what it looks like on a real card.
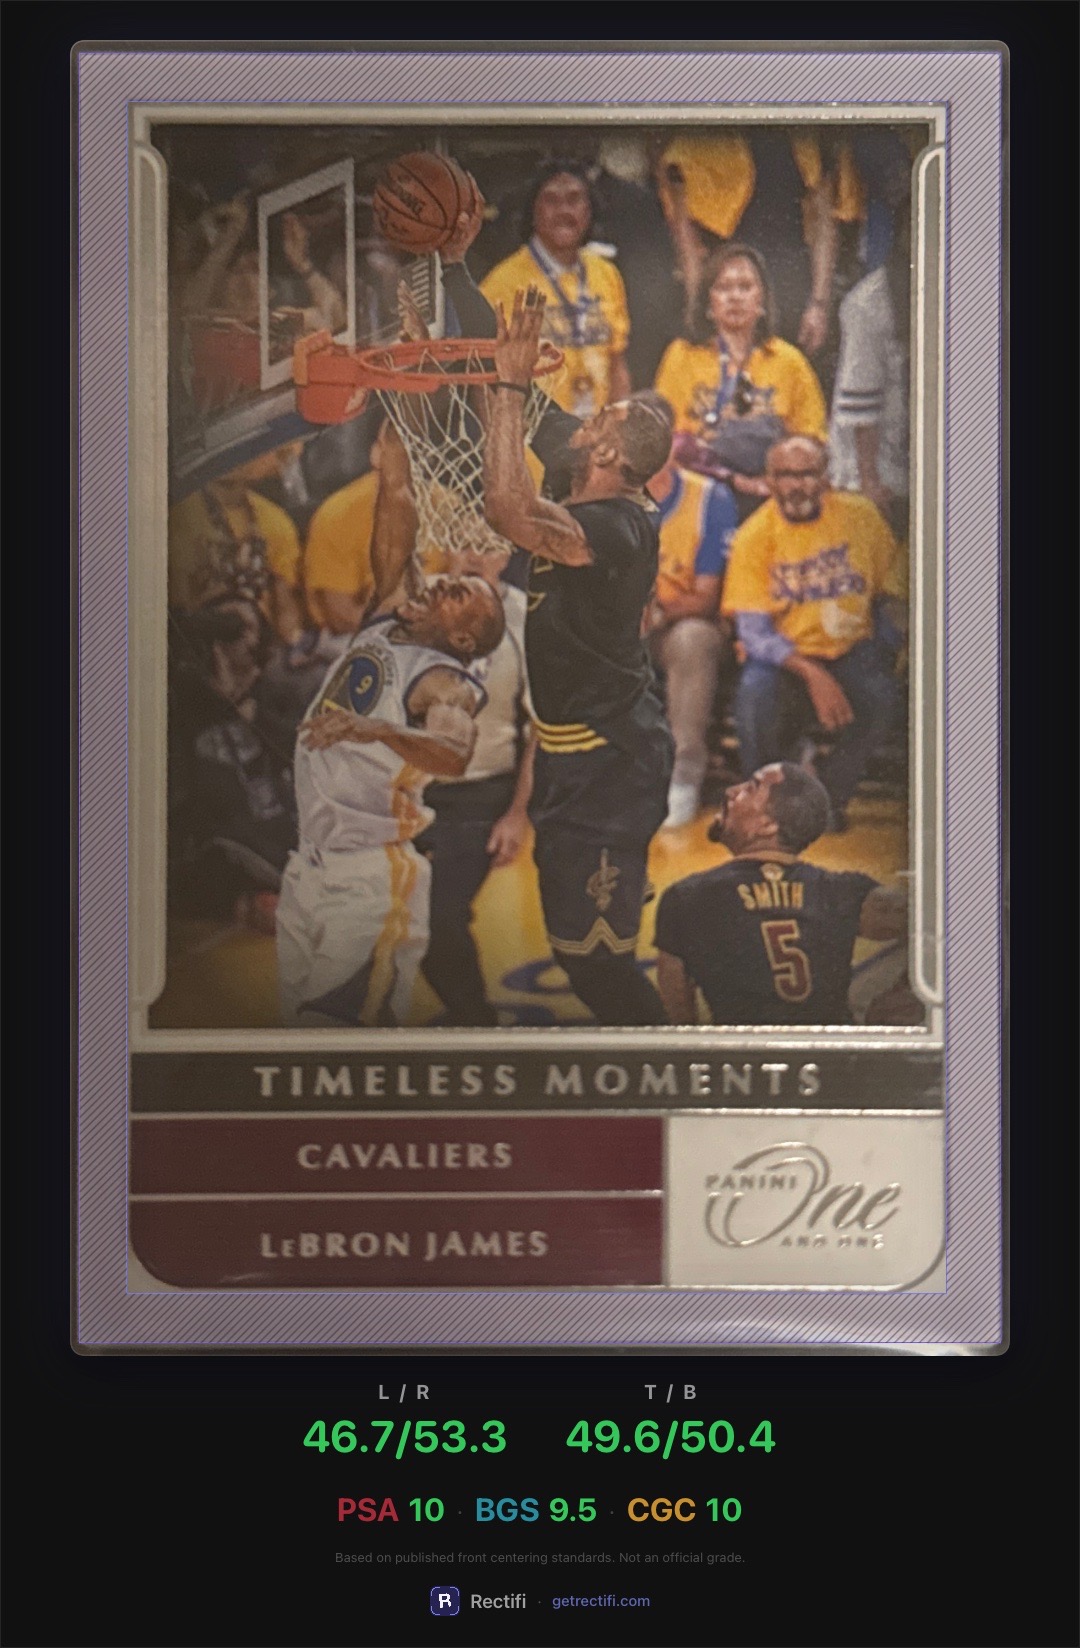
The worst axis is whichever measurement is further from 50/50. Here it’s L/R at 53.3, just outside 52/48.
Front Worst-Axis Distribution by Centering Subgrade
Each bar shows how many cards fall at that front worst-axis measurement. The dashed line marks 52/48, where almost all Centering 10s land.
Purple (Centering 10) dominates the left. Most 10s sit well inside 52/48. Past the dashed line, green (9.5) and blue (9) take over.
For 9.5 and 9, there’s no second threshold. What separates them is whether the other axis stays clean. BGS grades left/right and top/bottom independently, and the data reflects it: when one axis drifts, 9.5s almost always keep the other inside 52/48. With Centering 9s, both go off. The full pattern:
| Front axes (≤52/48?) | 10 | 9.5 | 9 |
|---|---|---|---|
| Both | 79% | 13% | 0% |
| Only One | 19% | 83% | 26% |
| Neither | 2% | 4% | 74% |
79% of Centering 10s had both axes inside 52/48. 83% of 9.5s had exactly one clean axis. 74% of 9s had both off.
The Pattern at a Glance
![]() Analyzed with Rectifi
Analyzed with Rectifi
The front makes or breaks your centering subgrade.
Check both axes against 52/48. To be conservative, measure where the ratio would be at its worst.
The Back Is Pass/Fail
BGS publishes explicit back thresholds: 55/45 for a Centering 10, 60/40 for a 9.5, 70/30 for a 9. The back is evaluated on its worst axis only. Either it clears that bar or it doesn’t.
The data confirms it. Nearly all Centering 10s (90%) had back centering within 55/45. A few went slightly over, but none approached 60/40. Every Centering 9.5 in the dataset cleared 60/40.
Having perfect back centering doesn’t earn you extra credit.
A card at 50/50 on the back gets the same subgrade as one at 54/46, as long as both clear the threshold. The back can only hurt you, not help you.
| Subgrade | Back limit | Data |
|---|---|---|
| 10 | ≤ 55/45 | 90% |
| 9.5 | ≤ 60/40 | 100% |
| 9 | ≤ 70/30 | 100% |
The Ratios in Perspective
The difference between a Centering 9.5 and a 10 is roughly the thickness of a sheet of paper.
I tried using a ruler and a caliper, but they weren’t the right tools for the job.
A ruler can’t reliably measure at the increments that matter here — the difference between grades is smaller than what you can consistently read or mark by hand.
A caliper has nothing to grip on a flat card, so the placement shifts every time. On a high value card, you’re also risking a scratch.
So I built Rectifi. The 155 slabs in this dataset were all measured with it.
If you’re new to measuring centering, this guide covers the full methodology — ratios, camera angle distortion, and what each grading service requires.
Takeaways
52/48 is the threshold that matters. Get both front axes inside it and you’re likely looking at a Centering 10. One crosses it, probably a 9.5. Both cross, probably a 9.
The back is a threshold check, not a gradient. BGS publishes explicit back thresholds: 55/45 for a Centering 10, 60/40 for a 9.5, 70/30 for a 9. Clear the threshold for your target grade and the back won’t cost you.
Use a tool you trust, and use it correctly. The margins are small enough that technique matters. Measure where the ratio would be at its worst to be conservative.
The data won’t guarantee your grade, but it’ll tell you where you stand before you pay to know.
Related: The Flex Rule: How PSA Grades Centering on 2025 Topps Chrome, which analyzes PSA’s two-reference approach on a single set.
Measure a Card Against These Thresholds
Rectifi corrects for perspective and measures centering from any photo. Free on iOS.
Dataset
- Total: 155 BGS-graded slabs — 93 sports cards, 62 TCG cards
- Centering subgrade: 58 with a Centering 10, 53 with a 9.5, 44 with a 9
- Overall BGS grade: 21 Black Label, 49 BGS 10, 53 BGS 9.5, 23 BGS 9, 9 BGS 8.5
The association between front axis pattern and centering subgrade is statistically significant: χ²(4) = 156.5, p < 0.001. The chi-square was computed with LLM assistance. If something looks off, I’d welcome a correction.
The pattern is strong, but not perfect. Some card designs are hard to measure reliably — one Centering 10 in this dataset read well outside the expected range, and other copies of the same card measured similarly off. That points to the border design, not the grader. Every card was also measured remotely, from images. Cards can bow or curve inside a slab, which may account for readings that sit unexpectedly close to or across a threshold.